第一步
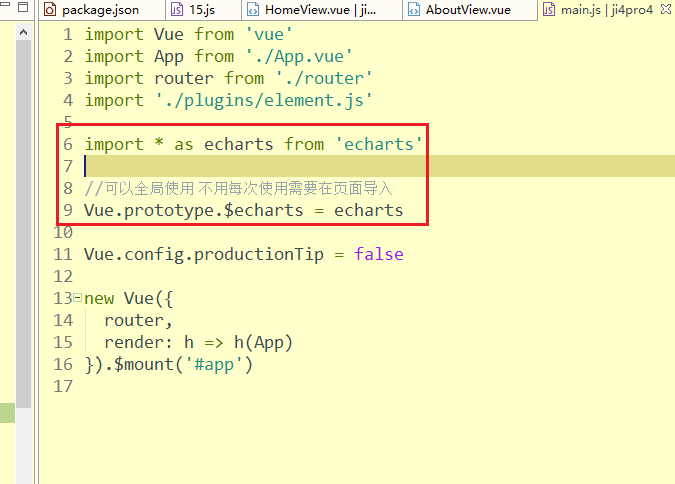
在main.js里面引入引入 Echarts:
import * as echarts from 'echarts';

//可以全局使用 不用每次使用需要在页面导入
Vue.prototype.$echarts = echarts
第二步
在页面中使用echarts
html:
<div class="echar" ref="bar"></div>
css样式:
<style scoped>
.echar{
    width:500px;
    height:500px;
}
</style>
js:
<script>

export default {
  name: 'ChartView',
  components: {
  },
  data() {
      return {
      }
  },
  mounted:function(){
      this.showBar()
  },
  methods:{
      showBar(){
          const myChart = this.$echarts.init(this.$refs.bar);
        //配置echarts
        // 指定图表的配置项和数据
        const option = {
            title: {
              text: '双十一服装销量'
            },
            tooltip: {
                show:true, // 是否显示提示框组件,默认值是true,可略
                trigger : 'axis'
            },
            legend: {
//                  data: ['销量'] // 如果 series 中有name,可略。这两个值如果都存在,那必须一致,否则图例不显示
            },
            xAxis: {
              data: ['衬衫', '羊毛衫', '雪纺衫', '裤子', '高跟鞋', '袜子']
            },
            yAxis: {},
            series: [
              {
                name: '销量',
                type: 'bar',
                data: [5, 20, 36, 10, 10, 20]
              }
            ],
            toolbox: {
                show: true,
                feature: {
                  saveAsImage: {
                    show: true
                  },
                  dataZoom:{
                  }
                }
              },
        };
        myChart.setOption(option);
    }


  }
}
</script>